Understanding family spending through data analysis
From an EU-wide perspective to the national and local trends in household expenditures
This data story explores family spending by using official EU bodies’ data. The analysis of family budgets reveals the complexities involved in household financial decision-making and identifies key trends in family spending. Each expenditure, whether on necessities or discretionary items, contributes to understanding a broader economic landscape by showing disparities across different socioeconomic groups.
Household expenditure indicators are essential components that offer valuable insights into these trends. They belong to the ‘statistics’ category of high-value datasets established by the European Commission, for their role in benefiting society and the economy. In this data story, we aim to explore various datasets within this category, offering an EU-wide perspective. Additionally, we will dive into national and local datasets to uncover specific and detailed insights, providing a more nuanced understanding of household spending patterns.
The Household Budget Survey
The Eurostat Household Budget Survey (HBS) is a vital tool for mapping how EU citizens spend their money. It collects data on family expenses, broken down by categories of goods or services bought.
The main goal of the survey is to understand the importance of different items used to calculate the consumer price index, a key metric for measuring inflation. However, the information from the survey, such as how much households typically spend and what they spend their money on, is also useful for economic studies and social research. HBS data is gathered at the national level every 5 years and then compiled and published by Eurostat, with the most recent data being from 2020.
The data gives a detailed look at what families buy, both in each EU Member State and across the EU. It breaks down spending into different categories, such as food and drinks, clothes and shoes, housing, health, transport and communication. This classification allows for a detailed analysis of spending habits and preferences across different Member States, giving a nuanced understanding of how families allocate their resources in various economic sectors.
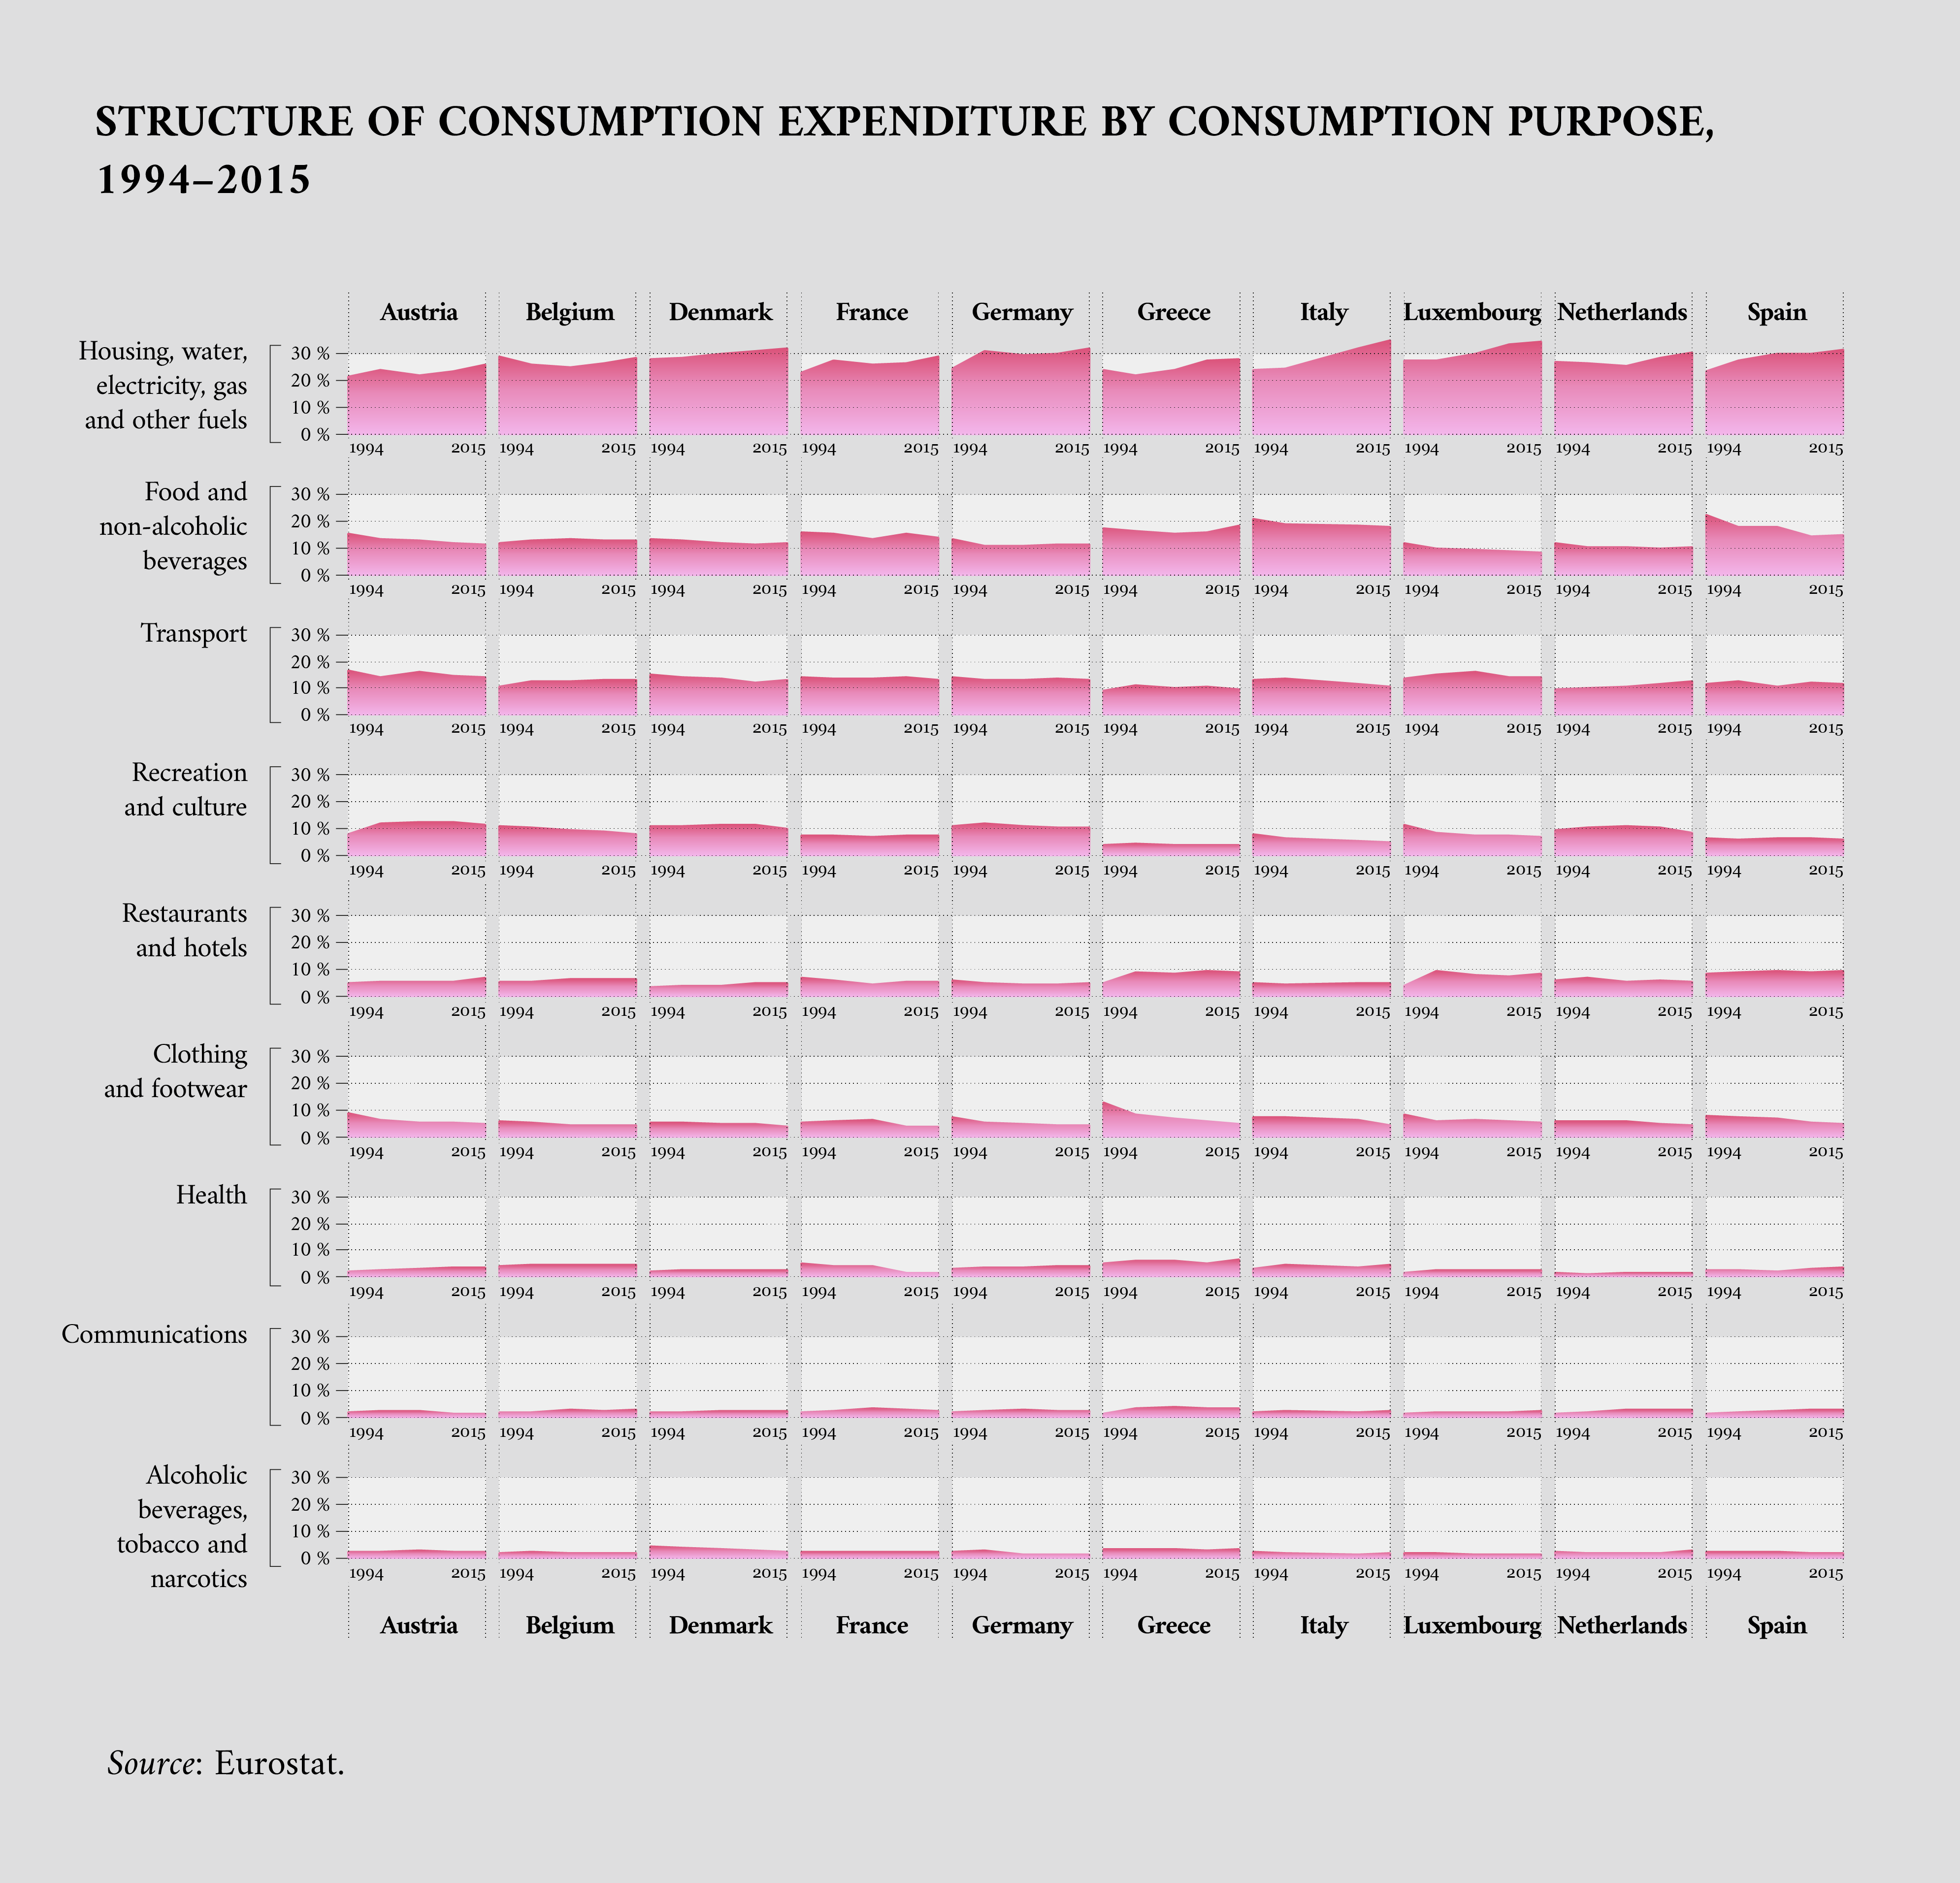
From 1994 to 2015, family spending trends across various categories showed distinct patterns. Notably, spending on housing, water, electricity, gas and other fuels indicated a significant increasing trend. In contrast, decreasing trends are found for alcoholic beverages, tobacco and narcotics, and clothing and footwear.
Changes were also observed in the communications category, where spending increased, likely reflecting the rapid technological advancements and increased adoption of communication services during this period. These are average trends across multiple Member States, but individual Member States may have shown unique trends for each category.
The following visualisation uses a HBS dataset to highlight some of the changes in the composition of family spending in some Member States from 1994 to 2015. Since data is not always available for every Member State and year, only the Member States with the most extensive time series are shown. Each category is shown as a percentage of the total amount the family spends, giving a clear view of how they distribute their budget across different types of products and services.
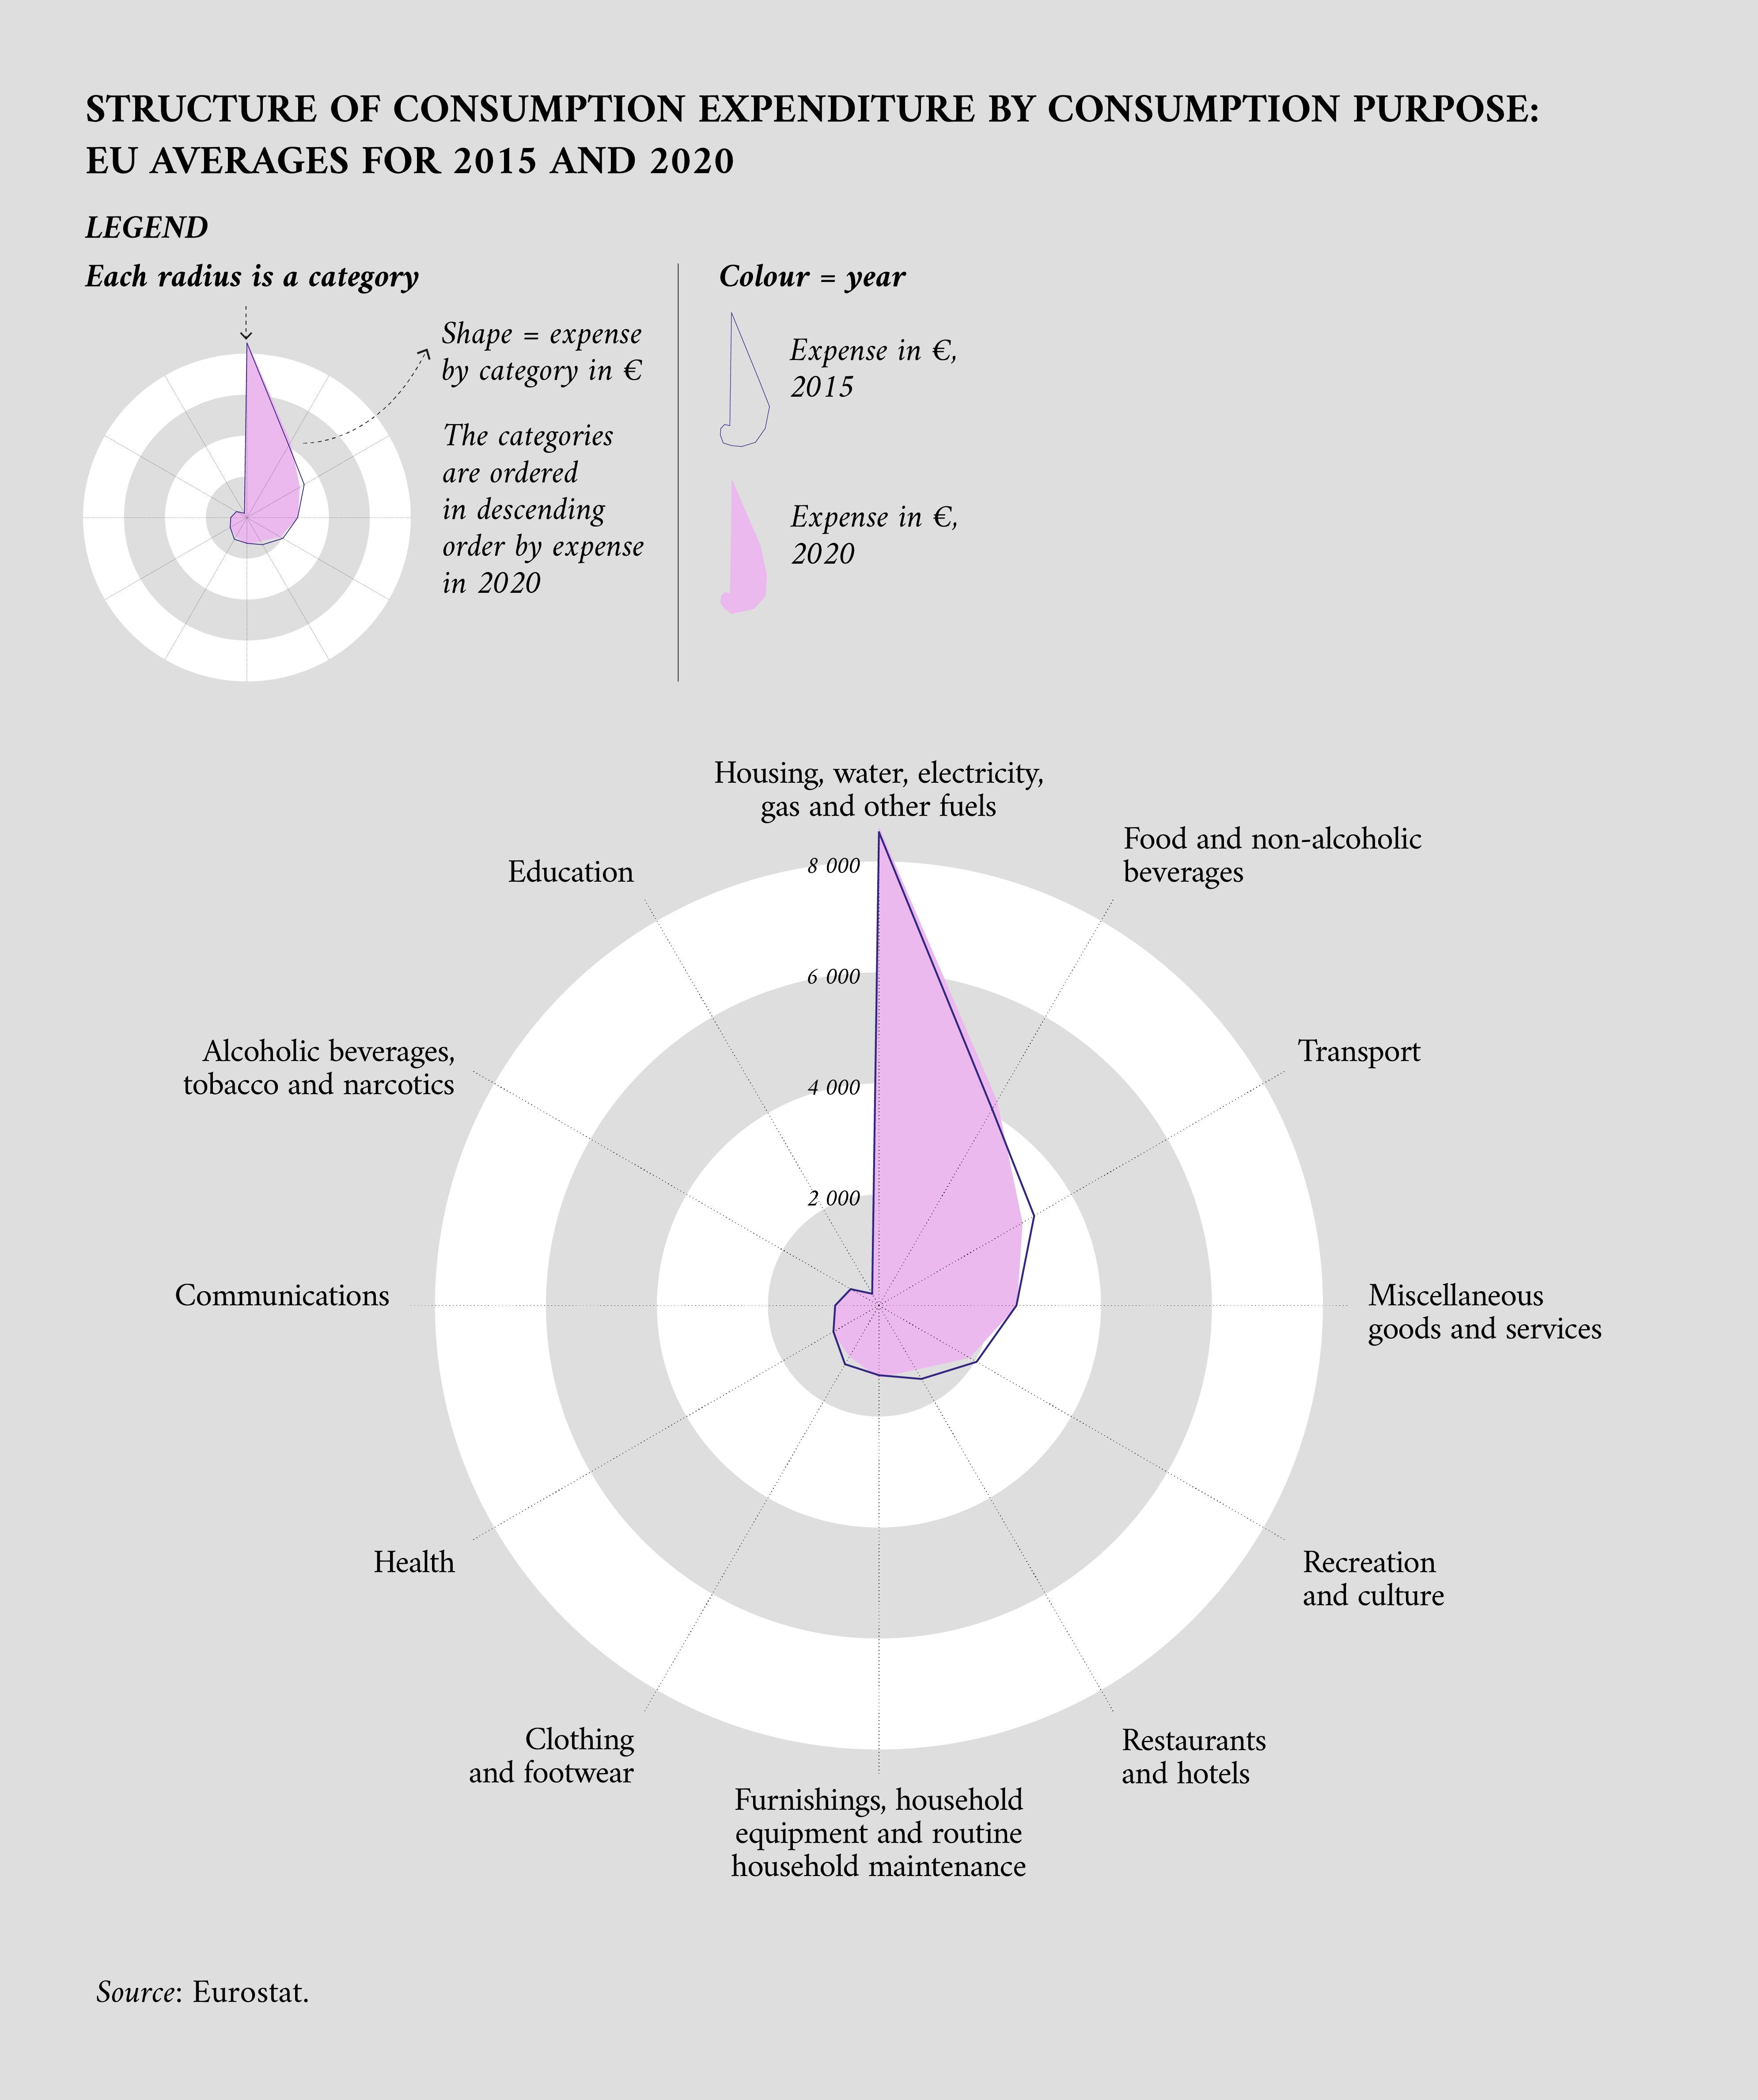
The HBS data also makes it possible to analyse the impact of the COVID-19 pandemic on family spending in 2020. The pandemic dramatically altered family lifestyles and spending habits, with lockdowns, social distancing and economic uncertainties changing the norm.
This information, highlighted in the following visualisation, shows changes in spending priorities, such as increased expenditures on home-related needs and decreased spending on travel and entertainment, reflecting the pandemic’s direct effects.
Family spending datasets on data.europa.eu
Apart from the abovementioned HBS data, other datasets published on data.europa.eu offer valuable resources for analysing household expenses, spanning from regional to local information.
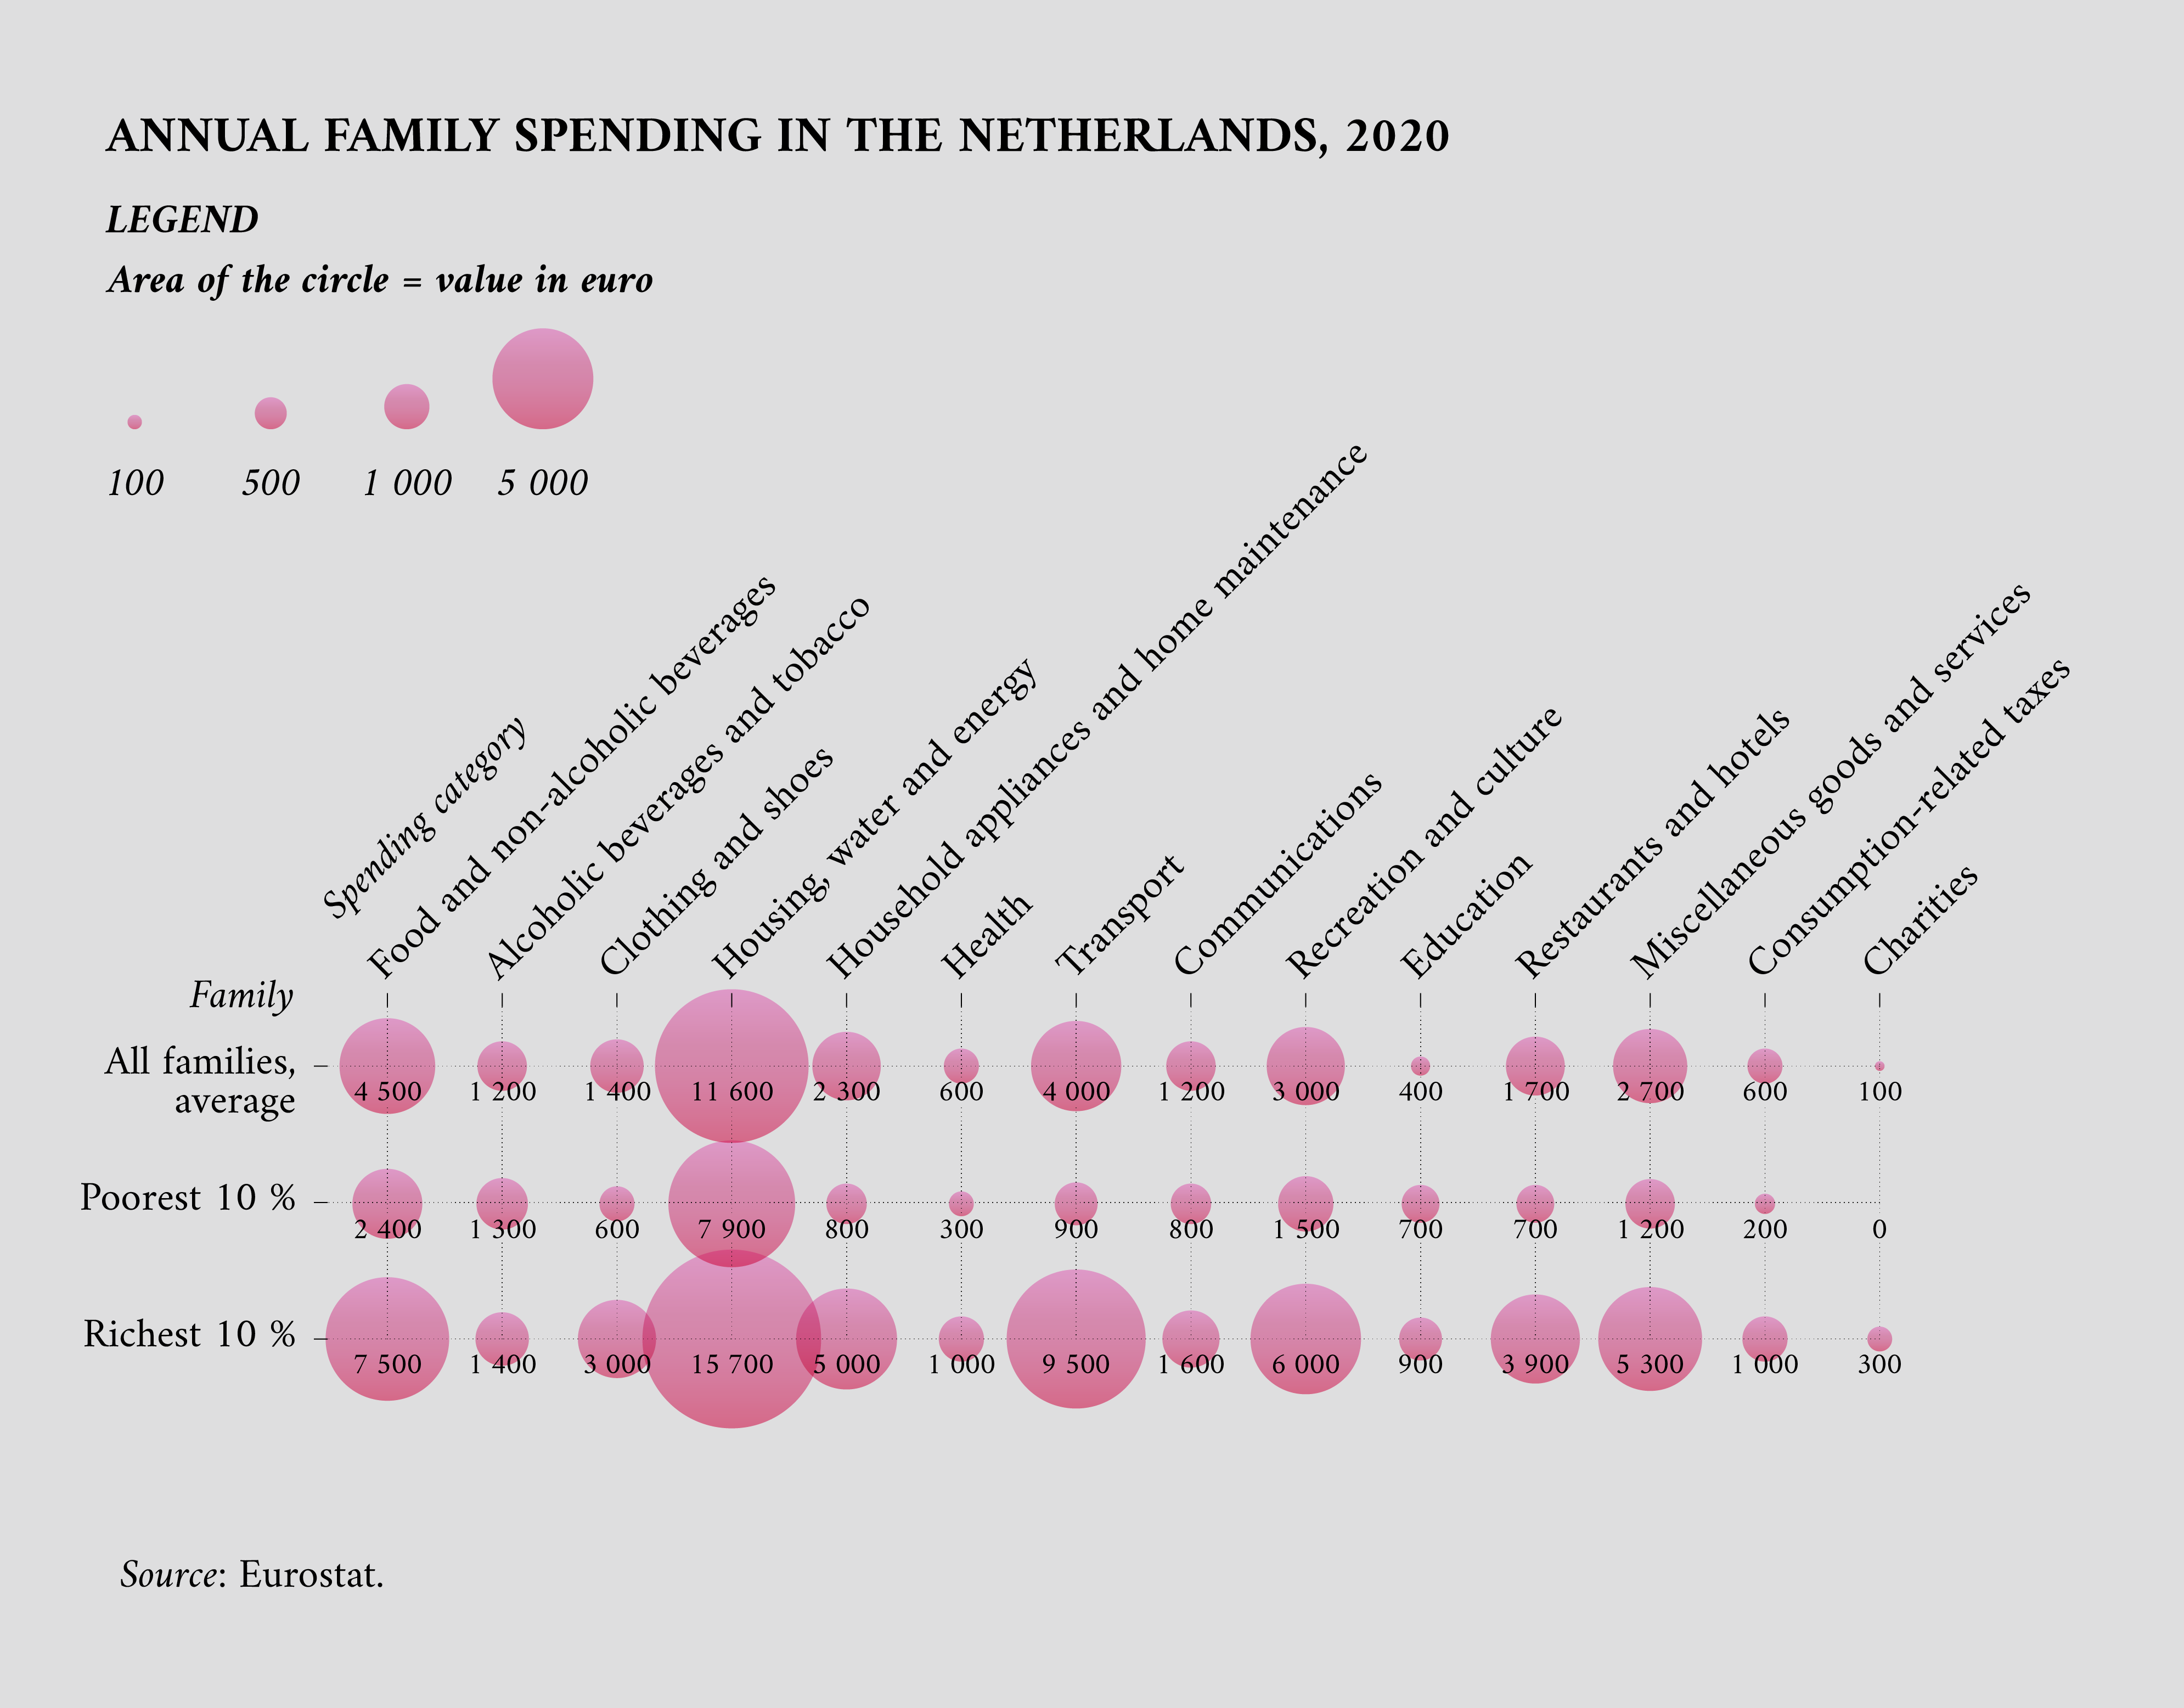
At the national level, one of the most interesting datasets shows what Dutch households spend their money on, breaking it down by the average for all families, the poorest 10 % of families and the richest 10 % of families. With information available up to 2020, it highlights what families with different levels of income spend their money on.
The expenditure data for Dutch families shows clear differences in how the poorest and richest 10 % of families use their budget. Lower-income families spend a larger portion of their money on essentials like housing, water and energy. They also spend a higher percentage of their income on things like alcoholic beverages and tobacco than wealthier families, although the actual money spent on these items is roughly the same for both groups. In contrast, wealthier families tend to spend more on transport, home appliances, maintenance and dining out. Also, the poorest families dedicate a greater part of their spending to education compared with the richest families.
These spending patterns from 2020 also reflect the effects of the pandemic, suggesting that there might have been an increase in spending on home-related needs and a decrease in expenses such as travel and eating out, along with a general trend to tighten overall spending due to economic strain.
The following visualisation details this information, highlighting how spending changes between rich and poor families and the effects of the COVID-19 pandemic in 2020.
The data.europa.eu portal also offers data at the regional level. Examples include datasets like family budgets in the Asturias region of Spain, which provides a focused classification of household expenditure by spending groups in a specific region.
This level of detail allows for in-depth analysis of consumer behaviour and spending patterns within narrower geographic confines, offering valuable insights into regional economic conditions and the unique financial behaviours of households in specific areas of the EU.
The Asturias data shows that food and non-alcoholic beverages are important, making up a large part of total expenses. Transportation also takes a significant share, followed closely by housing, water and energy costs. Other notable categories include spending on restaurants and hotels, while leisure and culture, clothing and footwear, health, furniture and household items and communications account for smaller portions of the budget.
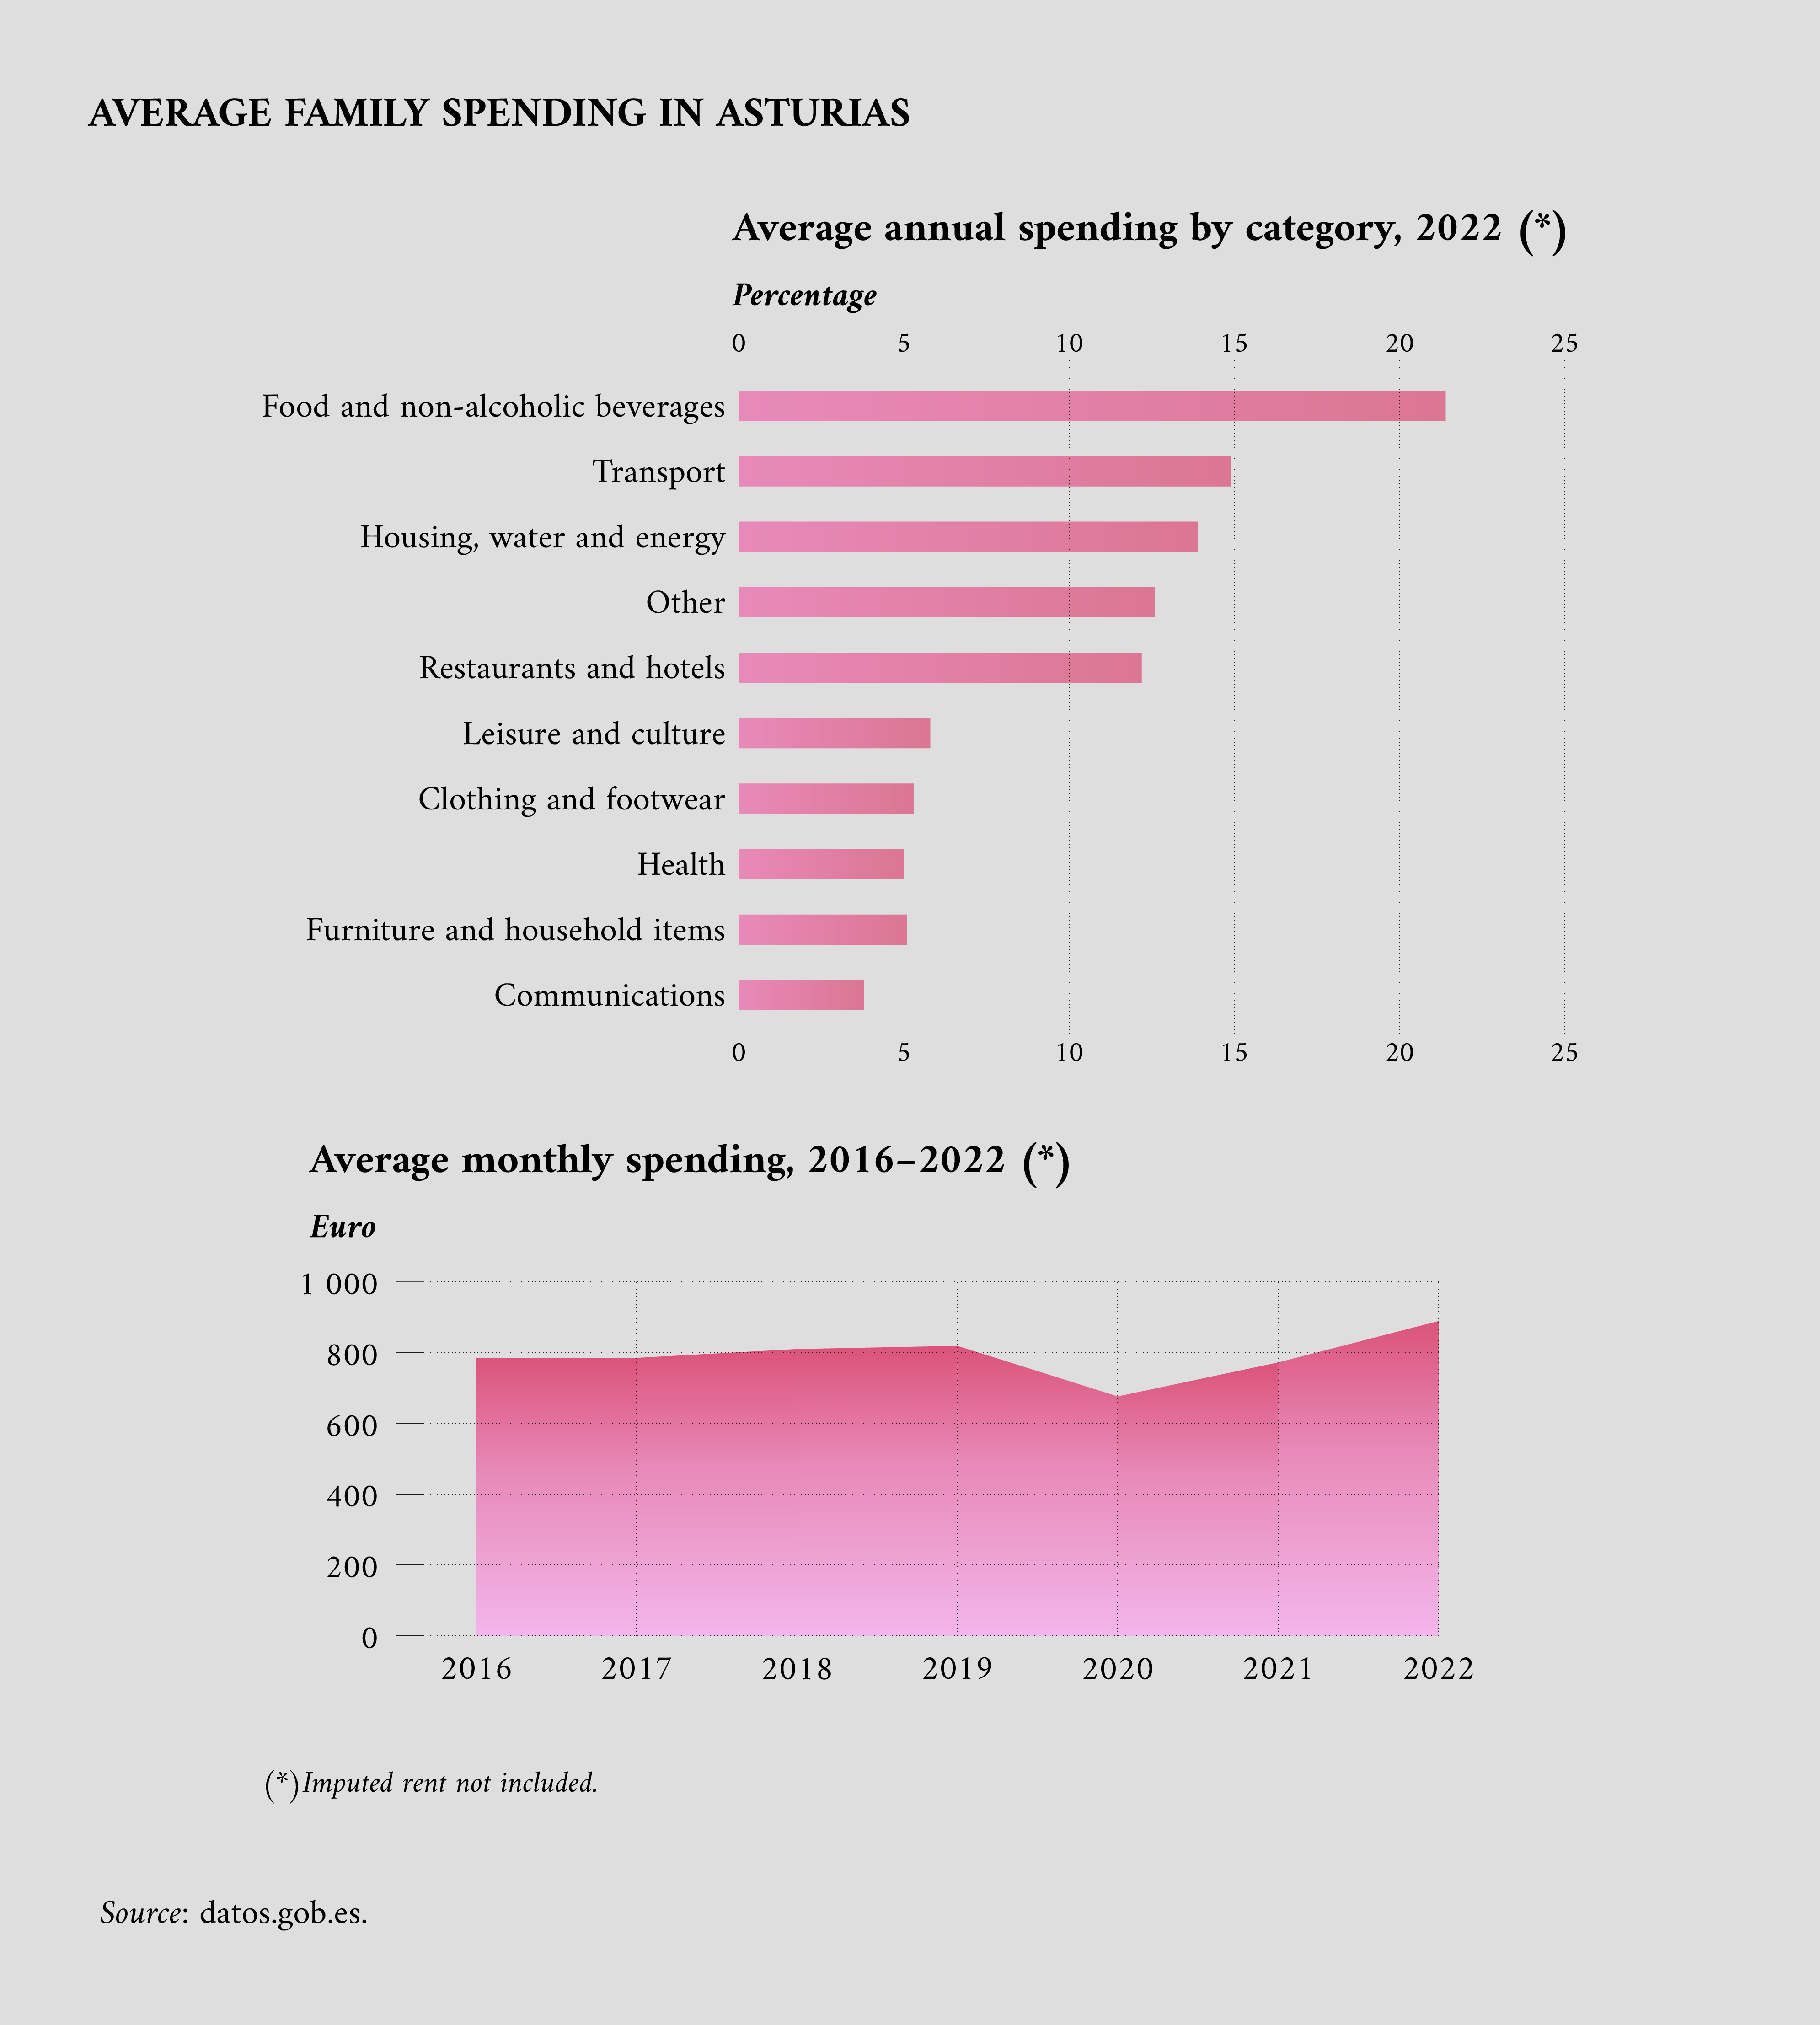
Over time, there has been a clear shift in the monthly spending habits of families between 2016 and 2022. Monthly spending remained stable in 2016 and 2017, followed by a gradual increase into 2019. In 2020, there was a sharp decline, reflecting the impact of the pandemic on consumption patterns. However, the subsequent years show a recovery, with spending picking up again in 2021 and rising significantly in 2022. The timeline above highlights the economic fluctuations over these years but does not adjust for inflation, which could affect the interpretation of the actual spending power changes over time.
In addition, the data visualised does not include imputed rent, an estimate of the rental value of a homeowner’s property used to measure the benefit of living in one’s own house.
Exploring additional data sources on family spending
There are several keywords that can be used to look for family spending data on the data.europa.eu portal. Examples include ‘household expenditure’, ‘family spending’ and similar terms.
Methodological notes
Despite ongoing efforts to standardise data collection, there are still limitations in comparing data from the HBS across different Member States. These challenges stem from variations in the survey methodologies each EU Member State employs, affecting the uniformity of the data. The inclusion or exclusion of imputed rent is the most important methodological difference. To mitigate these differences, Eurostat regularly recommends harmonisation measures and publishes detailed transmission documents to address these disparities.
Spending categories are defined as follows.
-
Food and non-alcoholic beverages: includes all food items and non-alcoholic drinks for household consumption, such as bread, milk and fruit juices.
-
Alcoholic beverages, tobacco and narcotics: covers items such as beer and cigarettes.
-
Clothing and footwear: encompasses all clothing items and shoes, for example, dresses and sneakers.
-
Housing, water, electricity, gas and other fuels: includes expenses related to housing, rent, water and electricity.
-
Furnishings, household equipment and routine household maintenance: contains items such as furniture, kitchen appliances and cleaning products.
-
Health: covers health-related products and services, including prescription medicines and medical consultations.
-
Transport: includes costs related to personal vehicles, public transportation and freight services.
-
Information and communication: involves electronic devices and communication services such as internet and phone bills.
-
Recreation, sport and culture: includes leisure activities and items, such as sports equipment, concert tickets and books.
-
Education services: covers education-related expenses at various levels, from preschool to higher education.
-
Restaurants and accommodation services: involves dining out and lodging services like hotels.
-
Insurance and financial services: includes insurance premiums and fees for financial services.
-
Personal care, social protection and miscellaneous goods and services: contains personal care products, social protection services and other miscellaneous expenses.
Article by Davide Mancino
Data visualisations by Federica Fragapane