The European Drug Report: A new approach to data sharing
Interview with David Penny, web manager at the European Monitoring Centre for Drugs and Drug Addiction
The European Drug Report is an annual report on the drug situation in Europe published by the European Monitoring Centre for Drugs and Drug Addiction (EMCDDA), an agency of the European Union. It provides an overview of the current drug landscape in Europe, focusing on aspects such as illicit drug consumption, associated risks and drug distribution.
For the first time, this year’s report was designed as a digital-first publication. It is interactive and visually rich, with over 100 data visualisations, graphics and maps. Additionally, all the source data behind the visualisations is available for sharing and reuse.
We met with David Penny, part of the core digital team for the project at the EMCDDA, to discuss the behind-the-scenes making of the report into a digital publication while including data publishing in the process.
When did you start publishing the European Drug Report?
The European Drug Report is almost as old as the agency itself! We’ve been publishing it every year since 1996, which is an impressive achievement in itself. It depicts the history of the drug situation in Europe over nearly three decades. It’s one of our ‘flagship’ products – it’s an important publication for our audience, for our stakeholders and for us.
The report has evolved over the years, but some things have remained constant: the analysis is data-driven (data is submitted annually by our partners in the Member States), it’s always been graphic-rich, and it’s always been conceived of as a printed (or downloadable) report.
What is new about the 2023 report?
The big change with this year’s report is that we moved to a digital-first approach. From the outset, we didn’t think of the report as a book to be read cover to cover but tried to develop it in ways that would work both as an online product (or series of interconnected products and modules) and a more traditional report for those who needed it. We didn’t merely want to make an HTML version of a printed/PDF report, which we’d done in the past – it was important for us that the product be ‘born digital’ so that we could take full advantage of the benefits of this approach.
Why did you decide to make the report digital-first?
There are so many reasons. We could say there were four overarching drivers for this digital-first approach: accessibility, openness of data, responsiveness (mobile friendliness) and findability (search engine optimisation). Whenever we found ourselves in uncharted territory, we could usually look to one of those four principles to guide us in the right direction. And the great thing about those principles is they are complementary – usually when you improve one, it gives the others a boost too; there’s a lot of synergy between them.
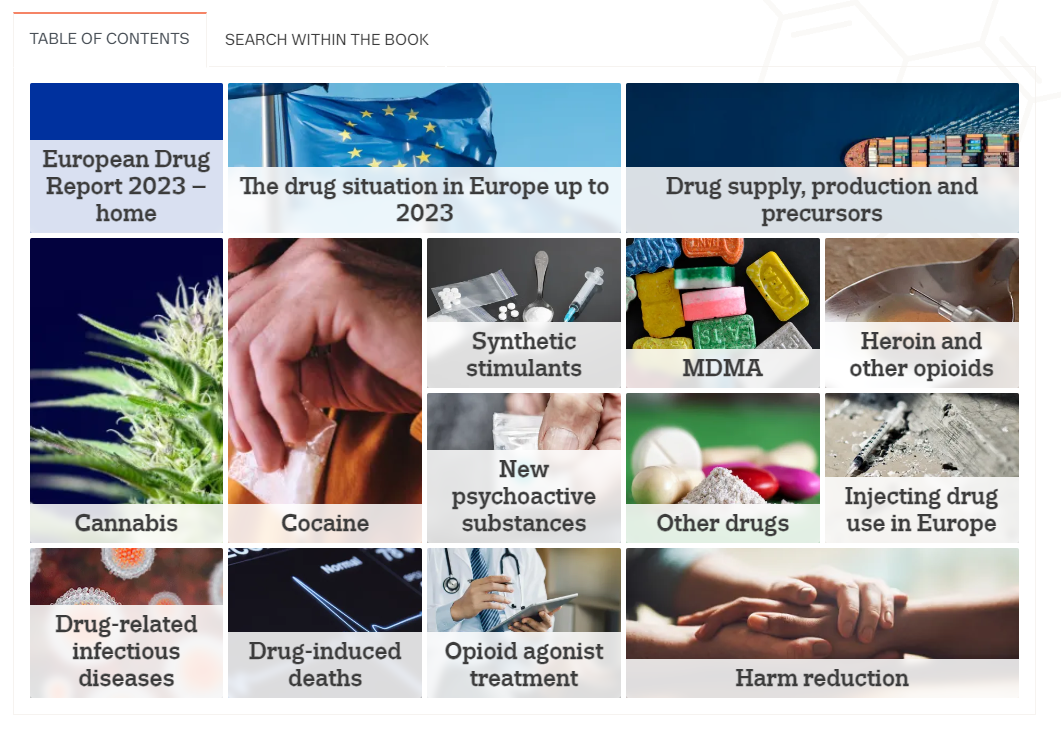
Interactive table of contents in the European Drug Report 2023.
Could you tell us a little bit more about the open data aspect?
It was a key aspect and probably had the biggest impact on the project and workflow. As I mentioned, the European Drug Report contains a wide variety of data visualisations. In the past, our data visualisations would be fully developed in external software, with data being inserted there directly. If any changes were made to the data, this would invariably be done only within the tool. As you can imagine, at some point, the original source data for the graphic would no longer match the data used in the graphic.
Also, when providing data this way, it was done purely for the purpose of creating the graphic, not with the intention of sharing the data later. And at the end of the process, we found it difficult to share source data from the report because it would have to be painstakingly reconstructed from the final graphics, supplemented with missing metadata, etc.
With the 2023 report, we really wanted to address this issue. As the report was to be built on our website, we could use our own web-based data visualisation library to build all the graphics and dashboards. We always made sure that all data tables were constructed in a way that made them reusable and shareable. Once the data was structured this way, it could be understood and imported into the data visualisation library to generate all the graphics and dashboards we needed for the report.
This way, we could uncouple the data visualisation aspect from the underlying data updating aspect. If we had to make changes to underlying data, we could do this directly in the source data, and all the data visualisations in the report would automatically update. By taking this approach, we already had all the data available in a shareable format by the time the report was published.
In addition, it made our graphics more accessible because it meant that close to each graphic, we could always provide an easy-to-read data table, for example for screen readers.
What challenges did you encounter when implementing these changes?
Of course, there were big technical challenges. We needed to develop new features and tools in our web content management system to meet all the requirements essential for the digital-first report. We had to work closely with the Translation Centre for the Bodies of the European Union to adapt the translation process. We also had to make a lot of changes to our data visualisation library to handle more complex graphics, such as dashboards and data explorers. All these technical aspects were very challenging but also rewarding because all of them were system changes (we just had to do them once), and now we can build upon them and use them for next year’s report and other outputs.
Did those technical challenges influence other aspects of the process?
Indeed, along with the technical challenges, there were human and organisational challenges. Going digital-first changed not just the output but the entire process – the writing and drafting, the workflow for providing data and creating graphics and the process for consultation and approvals. Our agency is quite innovative, but change is always daunting. We had to answer a lot of questions, demonstrate that the approach would work and show that our customers wanted this. It helped that we already had some experience with digital-first publications from previous projects and were confident we could achieve it, even if this time the scale was more ambitious. In the end, it was really rewarding to see everyone pull together; it was a huge collective effort, but without that, we wouldn’t have achieved our goal of a digital-first European Drug Report.
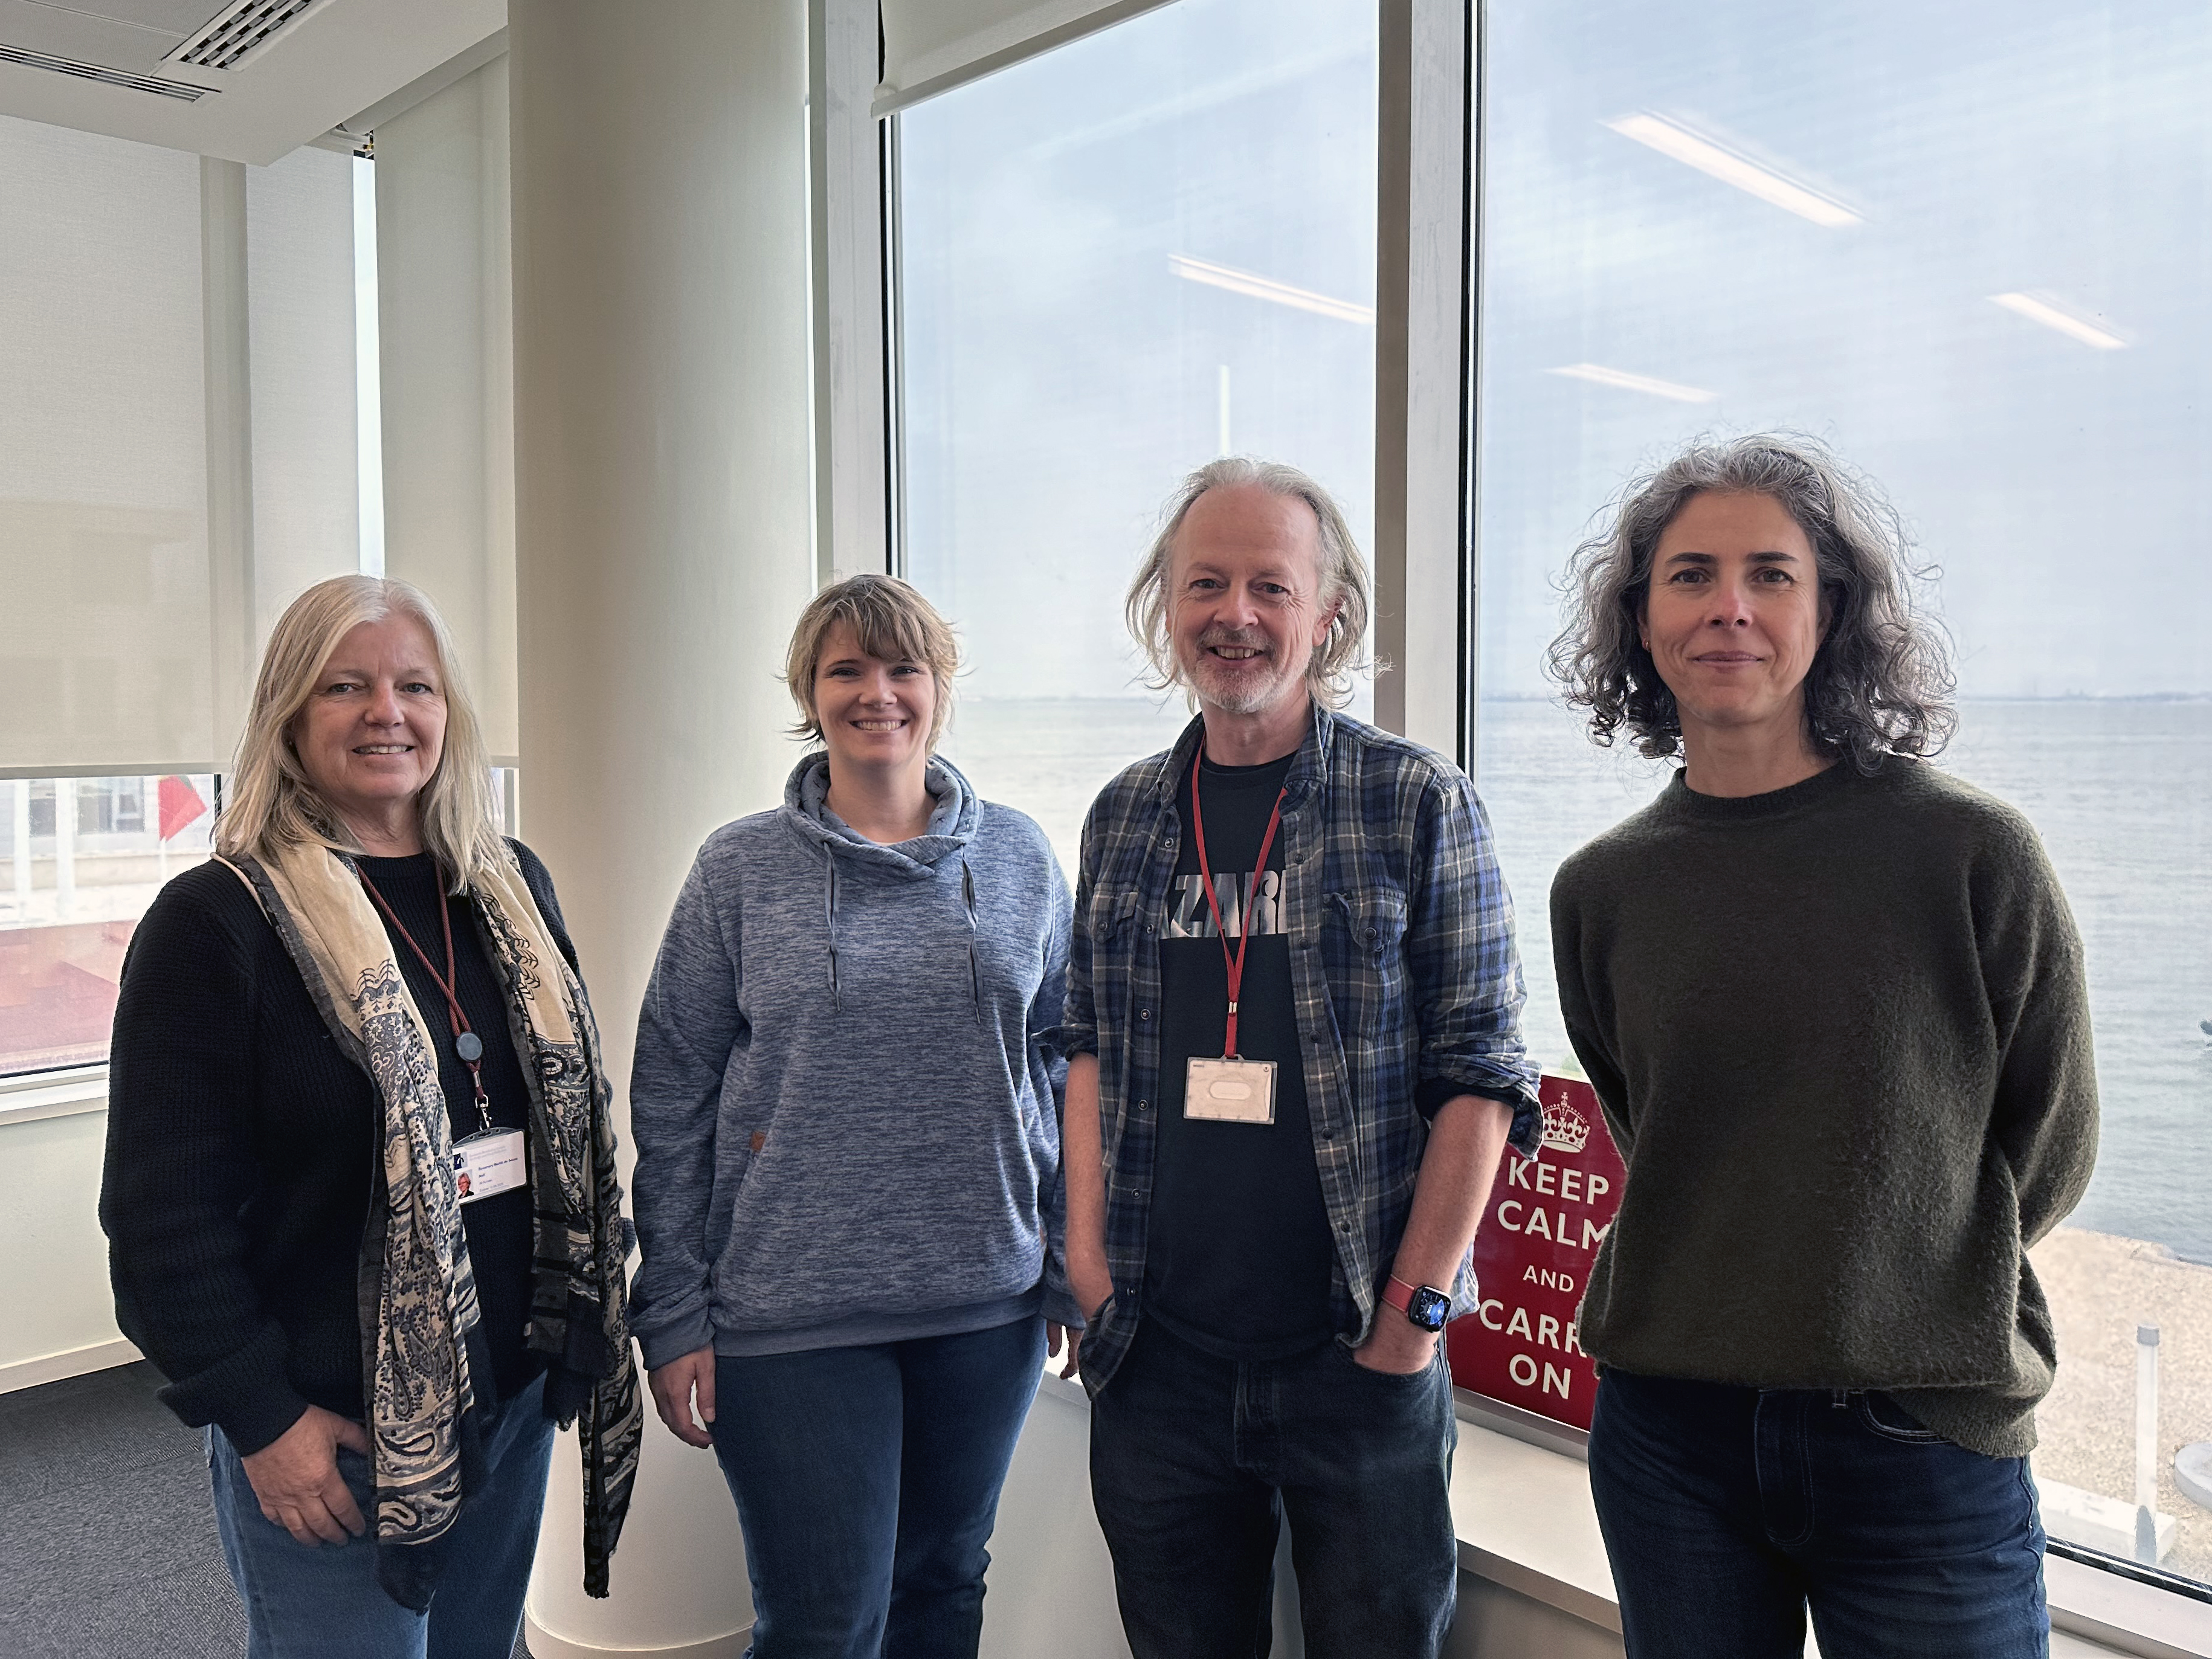
EMCDDA Digital-first European Drug Report — Communication core team members (from left to right): Rosemary Martin de Sousa, Silke Vitt, David Penny, Sónia Vicente.
What was the impact of the new approach?
Overall, it’s been very positive. Most people have responded favourably to the refurbished report. We can also see from our web metrics that these resources are being found and visited more than was the case with our previous PDF-only versions. Journalists, particularly data journalists, who in the past were asking us for source data, are now getting this data directly from our website, which is exactly what we want. As an organisation, we’ve moved a little further along in our digital transformation path.
Are you planning any further changes to your data sharing and publication processes in the future?
Yes, definitely! We still see ourselves as very much at the start of our open-data journey. We’re really grateful to our colleagues at data.europa.eu, who we see as guides we can turn to when we’re unsure of the next step. In fact, they helped us realise that the data in the European Drug Report was hard to share in the first place, and this, in turn, gave us the impetus we needed to fix the problem.
Even though our data is now easier to find and reuse, we want to keep improving – for example, by making the data available in more formats. But we’re not trying to change everything and everyone’s mindset all at once – so long as we are going in the right direction and we can see progress over time, we’ll be happy and, hopefully, so will our customers. We know we can count on the data.europa.eu team to accompany us on this journey!
If you are interested in finding out more about the European Drug Report and the work done by the EMCDDA, check out their website and consult their data via data.europa.eu.